
Complex, intermittent or hard-to-reproduce HW/FW faults. We find what others miss.
Intermittent faults are the most expensive problems in embedded development. They don’t reproduce on demand, they disappear when you add instrumentation, and they tend to resurface in production — or worse, in the field. Standard debugging workflows are designed for deterministic problems. Hard Probe Debug is designed for the ones that aren’t.
What we handle
- Faults that only appear under specific thermal, load, or timing conditions
- HW/FW interaction issues at the boundary between silicon and code
- Firmware crashes, hangs, and undefined behavior with no clear root cause
- Post-market failures where the reproduction path is unknown
- Production line anomalies that quality control can’t pin down
- Unexpected feature behaviour in the field
- Anomalous power consumption for battery operated devices
How we work
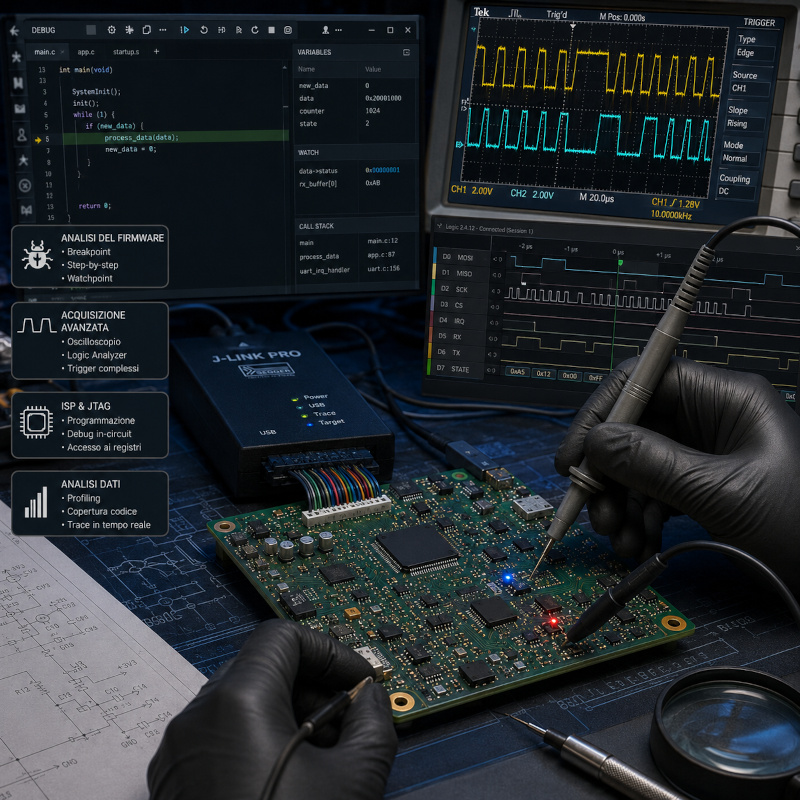
We apply cybersecurity analisys methodologies to debug activity, step-by-step, methodical investigation and lateral thinking. We start from the system as it is, no assumptions about where the fault lives. Instrumentation is applied directly to the hardware: logic analyzers, oscilloscopes, JTAG/SWD debuggers, current probes, protocol analyzers. Firmware is analyzed statically and dynamically, depending on what the fault profile suggests.
The output is a root cause report with reproduction conditions, fault mechanism, and — where applicable — a remediation path. Not a list of hypotheses: a diagnosis and a solution.
Forensic processes can be employed if the debug is related to legal concerns.
Who this is for
R&D teams stuck on a fault that’s blocking release. Production teams with an anomaly rate they can’t explain. Post-market engineering dealing with field returns that don’t fail on the bench. Lawyers and attorneys involved in hardware-related disputes.
If you’ve already tried the obvious, this is the next step.